PlotThatLUT
Based on OpenColorIO, PlotThatLut allows to plot a LUT to understand its color transformation.
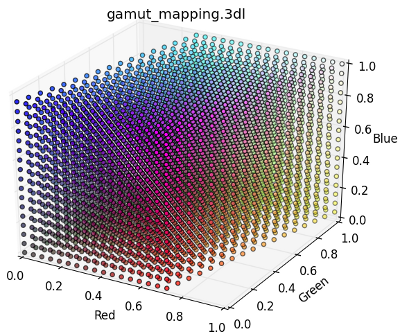
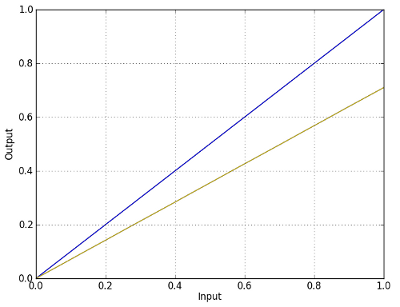
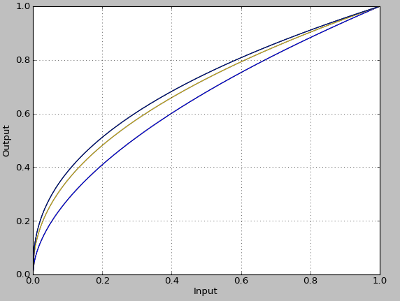
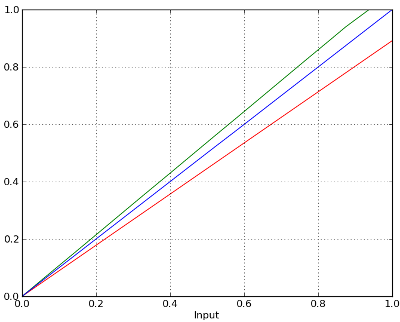
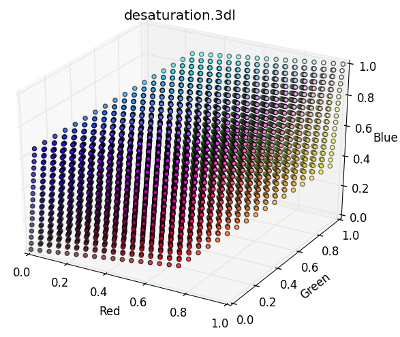
If it’s a 3D LUT, it displays a cube; if its a 1D LUT, a curve.
Supported input formats : .3dl, .csp, .cub, .cube, .hdl, .look, .mga/m3d, .spi1d, .spi3d, .spimtx, .vf
See OpenColorIO documentation.
PlotThatLUT can be used in command line :
python plotThatLut/ptlut.py -h
Or via the web service.
Examples :
Brightness
Gamma curves
Color temperature correction
Desaturation
Gamut mapping (AdobeRGB -> sRGB)